Barry Analytics Channel Integration for Linnworks Guide
In Barry Analytics , Dashboard displayed with following information :
- Revenue, Orders count view
- Revenue Chart: Source / Subsource wise Revenue view
- Total Orders (Order list table, Country Map ): Total Orders view Country wise
- Top 50 Selling SKU Chart (SKU list table, SKU Chart): Top 50 Selling SKU view
1.1 Revenue, Orders count view
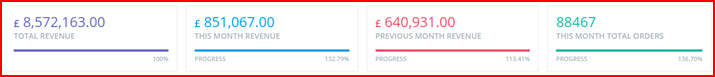
- Total Revenue
We get total revenue in first tab that is already calculated here. It is the total income of a business from all platforms / channels selected in configuration from beginning of your business.
By watching this revenue has rough idea how much amount of total revenue generated for your business.
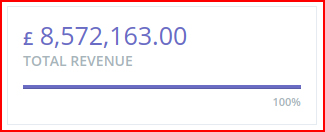
- This Month Revenue
Monthly revenue in second tab displayed revenue of your current month. You can see comparison of this month revenue with previous month.
You can see comparison of this month revenue with previous month percentage wise.
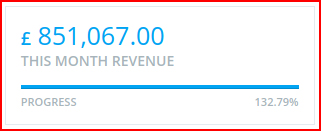
- Previous Month Revenue
Previous Month Revenue in third tab displayed revenue of your previous month. You can see comparison of previous month revenue with previous to previous month percentage wise.
- This Month Total Orders
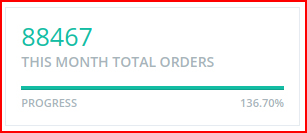
This Month Total Orders we can see entire month total orders. Also displayed comparison of this month order with previous month order percentage wise.
1.2 Revenue Chart
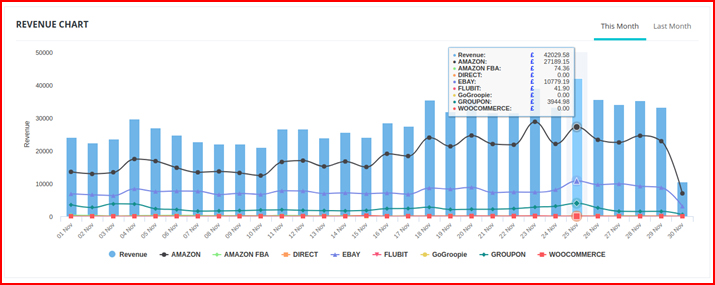
Revenue chart displayed revenue of different source ( platforms / channels )
X – axis = different source ( platforms / channels )
Y – axis = Revenue
Two option available
• This Month
◦ By default chart view This Month wise
• Last Month
◦ Click on Last Month ( In chart top right corner ) wise Revenue view
By comparison of this revenue chart get idea about revenue of each source (platforms / channels) .
1.3 Total Orders
This total orders shows overall orders from seller from different Countries.
• Total Orders view Country wise,
here two type of view Table list, Country Map
Table List
◦ Table Columns:- Country Name, Total Orders, Total Orders(%), Total Revenue(pound), Total Revenue(%)
In each column we can see the growth of total orders, orders percent wise, revenue and revenue percent wise with month and year or overall.
▪ Country Name: Country Name view
▪ Total Orders: Country wise total orders view
▪ Total Orders(%): individual country’s total orders * 100 / All Countries total orders
▪ Total Revenue(in pound): Country wise total Revenue view
▪ Total Revenue(%): individual country’s total revenue * 100 / All Countries total revenue here three option available ( Table Header right side)
▪ All, This Month, Last Month
▪ By default This Month wise all countries total orders view
Country Map
• Color difference shows the amount of total orders coming from particular country / place
• Dark color represents more orders, Respectively lighter color shows less orders
1.4 Top 50 Selling SKU
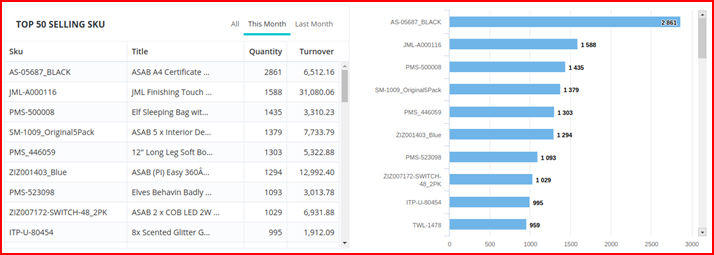
This Top 50 Selling SKU displayed Quantity, Turnover
• here two type of view Table list, Chart
Table List
◦ Columns:- Sku, Title, Quantity, Turnover
▪ Sku: SKU Name view
▪ Title: Product Name view
▪ Quantity: perticular Sku wise quantity view
▪ Turnover: perticular Sku wise revenue view here three option available ( Table Header right side)
▪ All, This Month, Last Month
▪ By default This Month wise top 50 selling sku view
Chart
• Particular Sku wise total quantity view
2. Reports:
2.1 Category Sales by Week
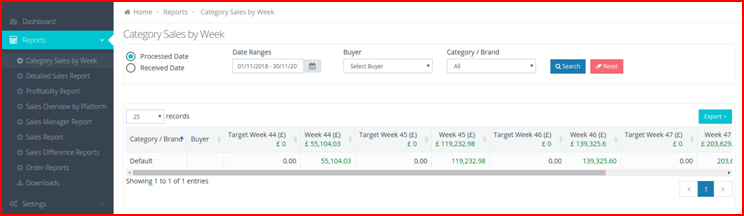
This report displayed Category Sales by week
• Search option

◦ PrProcessed Date, Received Date
◦ Date Ranges
▪ Today, Yesterday, Last 7 Days, Last 30 Days, This Month, Last Month, Custom Range
◦ Buyer: Particular buyer wise search
◦ Category / Brand: Particular Category / Brand wise search
• Category List Table
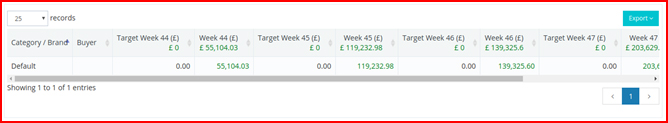
◦ Export in Excel ( In table on top right side)
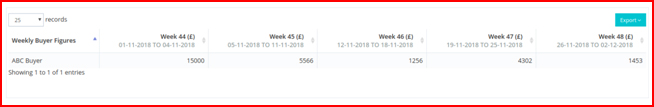
◦ Columns: Category / Brand, Buyer, Target Week, Week
▪ Category / Brand: Category Name view
▪ Buyer: Buyer name view
▪ Target Week: here view revenue, This revenue Target assign perticular Buyer ( Target assign option available in Manage Buyer (in Settings Menu)) wise
▪ Week: week wise revenue view,
• you can see image as above
• Example:
◦ Week44 : 01-11-2018 To 04-11-2018
◦ Week45: 05-11-2018 To 11-11-2018
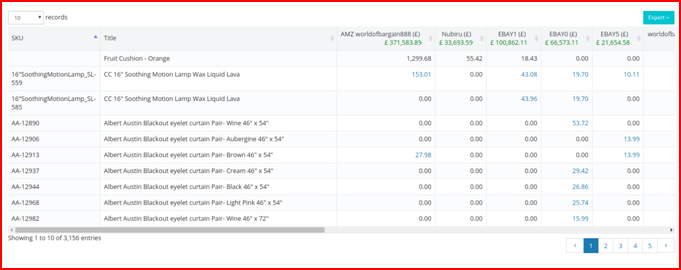
2.2 Details Sales Report
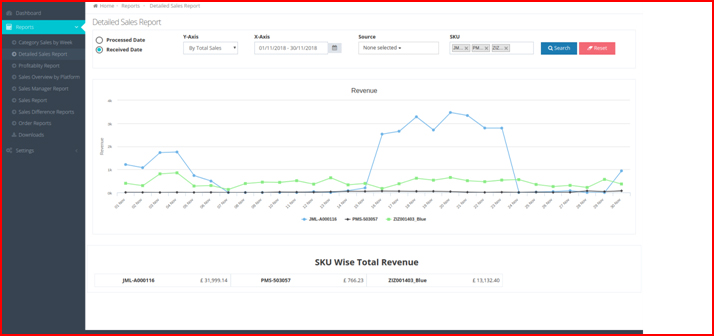
This report displayed Detailed Sales
• Multiple SKU wise sales reports in a chart and also with total revenue particular SKU wise view (you can see image as above)
• Search option

◦ Processed Date, Received Date wise search
◦ Y-Axis: in chart left side view 0k, 1k, 2k, 3k
▪ Example: 1k- 1 thousand, 2k- 2 thousand
◦ X-Axis: Date rang wise search, in chart bottom view 01 Nov, 02 Nov, 03 Nov
◦ Source: Selected source wise search
◦ SKU: Multiple SKU wise search
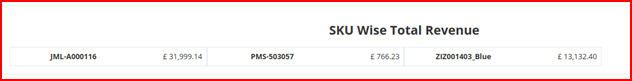
• SKU wise Total Revenue
◦ Here, Particular SKU wise revenue view ( selected search wise ), you can see image given below
2.4 Sales Overview by Platform
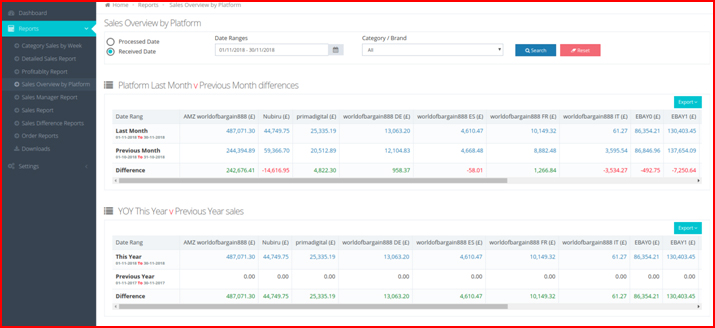
This report displayed Sales Overview by Platform
• Sales overview particular Category / Brand wise ( selected date rang )
• Search Option
◦ Processed Date, Received Date wise search
◦ Date Ranges: Select date range
▪ Click on calendar icon, after click you can see select date range option available,
▪ Date Range option : Today, Yesterday, Last 7 Days, Last 30 Days, This Month, Last Month, Custom Range
• Sales overview list
◦ Here, Two list table view (you can see image given above)
▪ Platform Last Month V Previous Month Sales differences
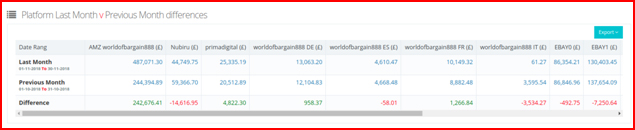
• Here, Three rows view,
◦ Last Month with date range
◦ Previous Month with date range
◦ Difference ( Last Month and Previous Month )
• Export option ( This option view in Table top right corner, you can see image given above)
◦ This report also export in Excel
▪ YOY This Year V Previous Year Sales differences
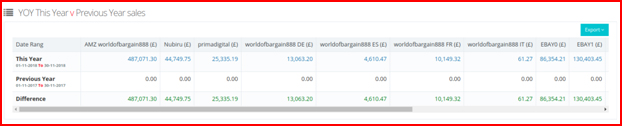
Three rows view,
◦ This Year with selected date range view
◦ Previous Year with selected date range view
◦ Difference: Compare with This Year and Previous Year
• Export option ( This option view in Table top right corner, you can see image given above )
-
-
- ◦ This report also export in Excel
-
2.5 Sales Manager Report
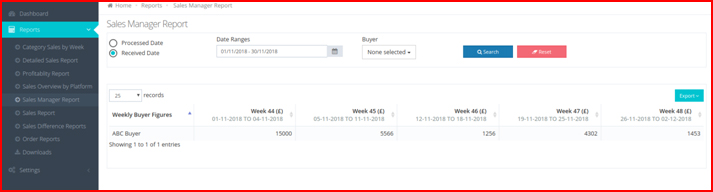
This report displayed Sales Manager Report
Particular Buyer Assigned Target week wise Sales report view ( Assign target option given in Manage Buyer( in settings menu) )
• Search Option

◦ Processed Date, Received Date wise search
◦ Date Ranges: Date range wise search
▪ Click on calendar icon, view options for select date range
• options: Today, Yesterday, Last 7 Days, Last 30 Days, This Month, Last Month, Custom Range
◦ Buyer: Buyer wise search
• Search Option
▪ Export option ( This option view in Table top right corner, you can see image given above )
• This report export in Excel
▪ Particular Buyer wise weekly revenue view
2.6 Sales Report
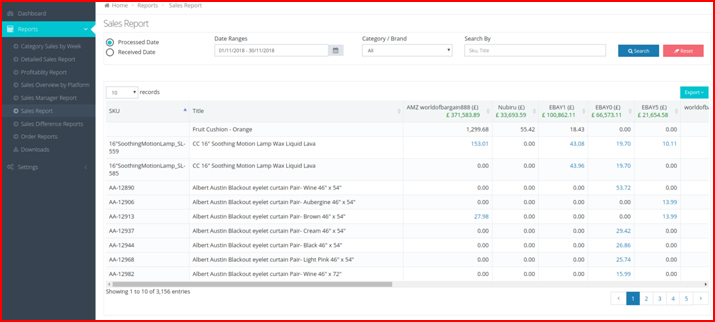
This report displayed Sales Report
• Particular SKU wise or SKU’s Source wise Sales report view
• Search Option

◦ Processed Date, Received Date wise search
◦ Date Ranges: Date range wise search
▪ Click on calendar icon, view options for select date range
• options: Today, Yesterday, Last 7 Days, Last 30 Days, This Month, Last Month, Custom Range
◦ Category / Brand: Category wise search
◦ Search By: SKU, Title wise search
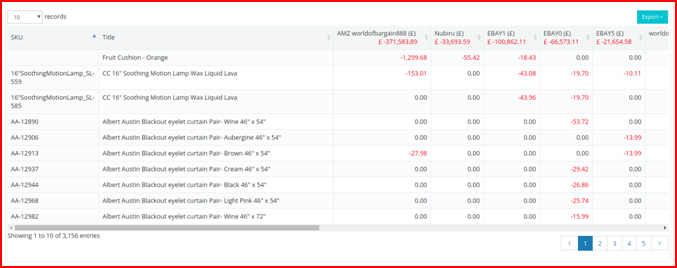
• Sales Report List
option ( This option view in Table top right corner, you can see image given above )
▪ This report export in Excel
◦ Particular SKU wise all Source revenue view
▪ Source view in columns, Source columns start on 3 number column
2.7 Sales Difference Reports
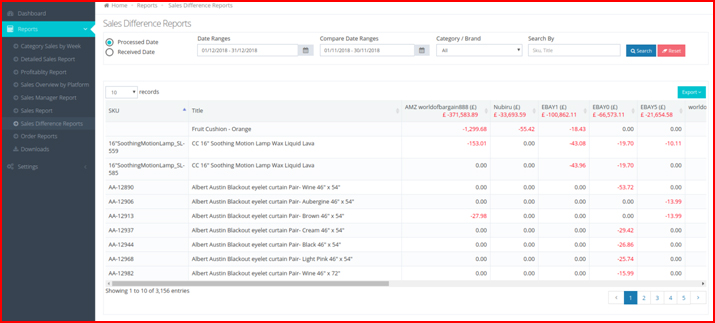
This report displayed Sales Difference Reports
• Particular SKU wise all sources revenue view
• Search Option

◦ Processed Date, Received Date wise search
◦ Date Ranges: Date range wise search
▪ Click on calendar icon, view options for select date range
• options: Today, Yesterday, Last 7 Days, Last 30 Days, This Month, Last Month, Custom Range
◦ Compare Date Ranges: Date range wise search, This date range compare with ahead selected date range
▪ Click on calendar icon, view options for select date range
• options: Today, Yesterday, Last 7 Days, Last 30 Days, This Month, Last Month, Custom Range
◦ Category / Brand: Category wise search
◦ Search By: SKU, Title wise search
• Sales Difference Report list
◦ Export option ( This option view in Table top right corner, you can see image given above )
▪ This report export in Excel
◦ Perticular SKU wise all Source revenue view
▪ Source view in columns, Source columns start on 3 number column
2.8 Order Reports
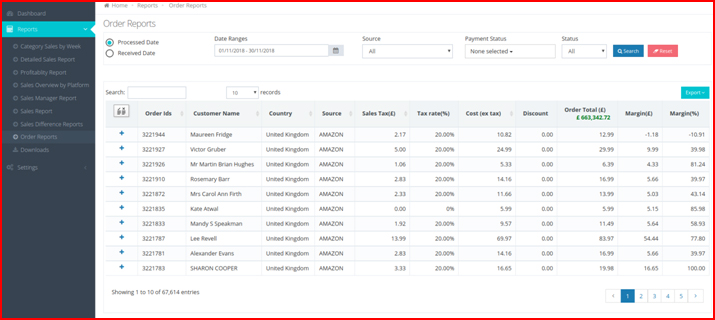
This report displayed Order Reports
• All Orders view selected date range wise
• Search Option

◦ Processed Date, Received Date wise search
◦ Date Ranges: Date range wise search
▪ Click on calendar icon, view options for select date range
• options: Today, Yesterday, Last 7 Days, Last 30 Days, This Month, Last Month, Custom Range
◦ Source: Source wise search
◦ Payment Status: Payment wise search, Paid, Unpaid, Resend
◦ Status: Order status wise search, Here two option given,
▪ Open – Order In process
▪ Close – Order delivered ( Customer Receive order)
• Order Report List
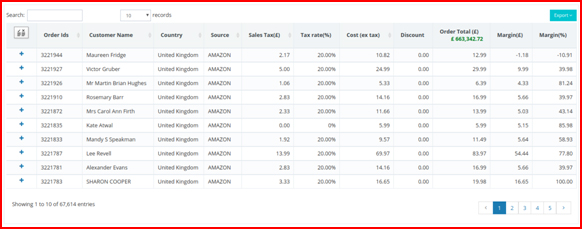
◦ Export option ( This option view in Table top right corner, you can see image given above )
▪ Click on this button two option given
• Summary Report – Only orders report export
• Details Report – Orders with items report export
◦ In Table list
▪ Header: 1st column Image given, Click on this view Columns list with check box, here selected name are show in table, and unselected name not show in table if you select than view this column name in table
▪ In table order report record view rows,
• Plus Icon: Click on plus icon than view all Items in a table
2.9 Downloads
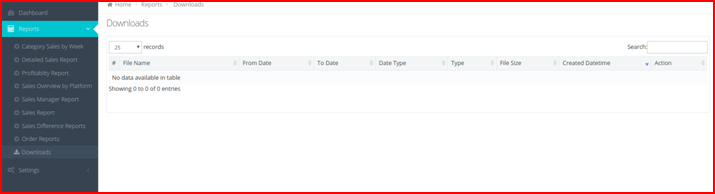
• View Excel file list
• Order Reports: when export excel file than make excel file in process background, This export excel file view here with download option ( Download icon given in Action column )
3. Settings:
3.1 Application Settings
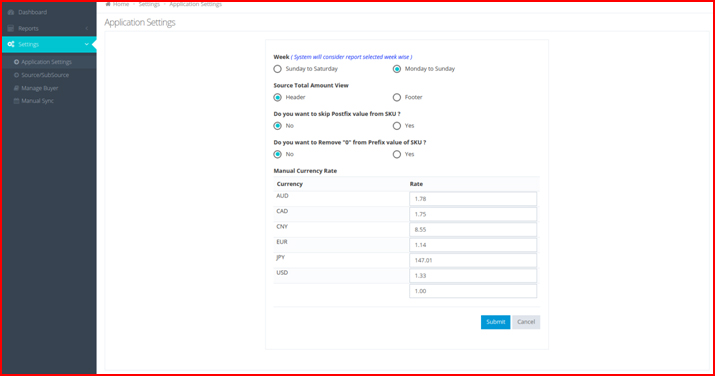
In Application Settings we have following options:
• Week: Two option given above image ( System will consider report selected week wise )
◦ Sunday to Saturday
◦ Monday to Sunday
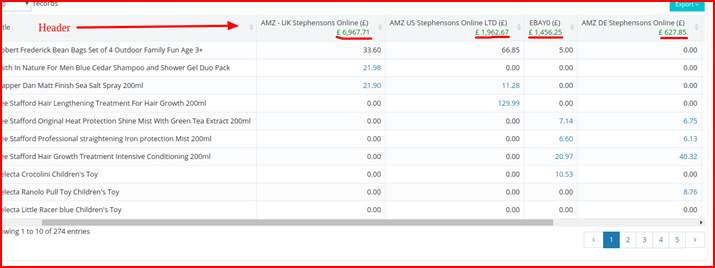
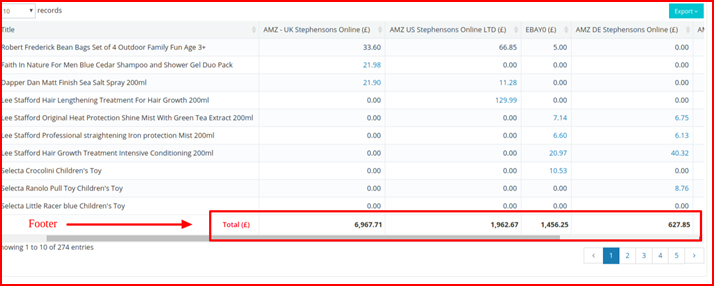
• Source Total Amount View: Two option given above image
◦ Header
◦ Footer
if Header option select, system will consider total revenue view in all list page, You can see in all Reports module.
If Footer option select, system will consider total revenue view in all list page ( total revenue view in table’s footer ), You can see in all Reports module. Also you can see below image
• Do you want to skip Postfix value from SKU ?
Here, Two option given
◦ No — if this option select, no any changes in whole project
◦ Yes – if this option select,
▪ Where SKU name view there effect.
For Example: Sku name abc_123456 to 123456 changed in whole project
• Do you want to Remove “0” from Prefix value of SKU ?
Here, Two option given
◦ No – if this option select, no any changes in whole project
◦ Yes – if this option select,
▪ Where SKU name view there effect.
For Example: SKU nae 0123456789 to 123456789 change
• Manual Currency Rate
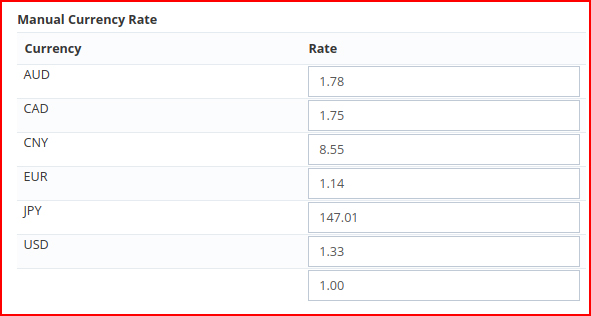
Here,
• Manual set currency rate (this changes effect in where revenue view)
3.2 Source / Subsource
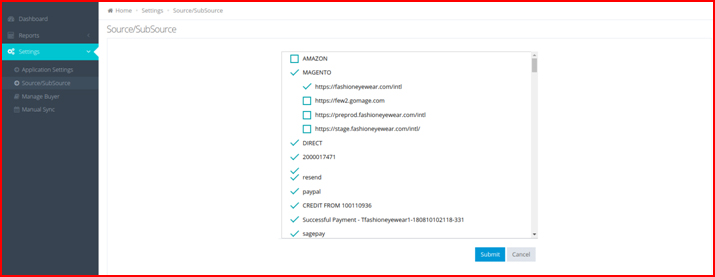
Here,
• Selected Source view in whole project (In Reports: all report modules, Desktop: revenue chart)
3.3 Manage Buyer
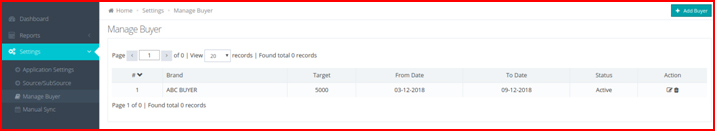
Here,
• Buyer assign target list page view
• Assign target to Buyer : Add Buyer button see given above image
◦ Add Buyer Form:
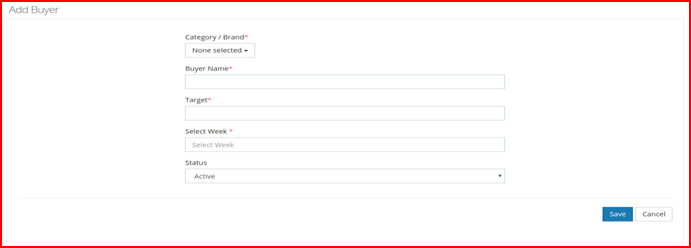
▪ Category / Brand: Category / Brand list in Dropdown, click on dropdown
• Assigned target effect in given below modules list
◦ Category Sales by Week
◦ Sales Manager Report
3.4 Manual Sync
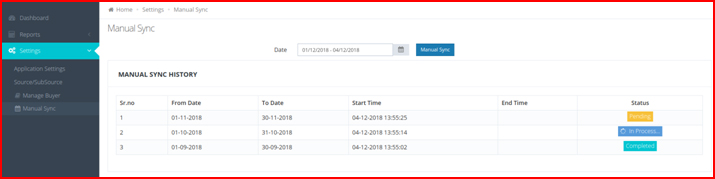
Here,
• Data fetch from Linnworks
• First time application create in Linnworks
◦ Do one time sync all data here(one time only 1 month sync)
here, you can sync multiple month date range wise
toggle