What made you started selling? Maybe you loved the thrill of getting the sales in, and offering great customer service, or maybe you started because you wanted to offer really great products. Whatever your reason for starting out in eCommerce, we’re willing to bet that it wasn’t because you wanted to do sales reporting and play with spreadsheets.
So many multi-channel sellers have told us they find reporting and dealing with their business data complicated, with many of them resorting to using an accountant (or other professional) who charges loads of money, takes ages to get back to them and then maybe doesn’t even get them the figures they were looking for. There has to be a better way, right?
We thought so; and we’d already developed our mobile app LinnKwik for at-a-glance reporting showing:
✔ Total orders
✔ Top selling channels
✔ Top selling products
✔ Total number of transactions
✔ Average reporting for products and transactions
 Sellers tell us they love LinnKwik because it gives you great reporting for your money – and costs less than £1 a week! But LinnKwik was always designed for basic reporting, to give you real-time figures on-the-go, on a small screen like your smartphone. Although it’s great, it doesn’t completely eliminate those costly accountancy bills, or the time you spend waiting for your figures coming back from the accountant.
During a chat with Barry from SOL Retail, we got onto the subject of how tricky it can be to get the reports you need, particularly when there are multiple systems involved – complex file exports and spreadsheets filled with data that needs filtering can send even the best sellers (like Barry!) speed-dialling their accountant.
As a result of that conversation, we combined our technical expertise with Barry’s award-winning retail experience to make the magic happen. It took a bit of time, but we’re proud of the finished product – and we were so pleased with our collaboration with Barry, we named the app after him.
So, without further ado, we present:
Barry Analytics by EBG
Barry Analytics gives Barry access to the reports he needs regularly, and he can customise the data with ease. For around the same price as your daily take-away coffee, Barry Analytics can provide your business reporting too.
There’s no complicated file exports or messing about with Excel to see your data, (although if you prefer, you can of course download it for review and editing in Excel) Barry Analytics gives you complete integration with Linnworks and the marketplaces you’re selling on, so an overview of all your business data is displayed in one place – the dashboard.

The Barry Analytics dashboard shows you this month and last month’s revenue on a clear, easy to understand bar chart with data points for your sales channels – and you can simply click to add and remove channels for quick comparison.
For more in-depth reporting, the following reports are available as standard, and can be as simple, or complex, as you need. All these reports have customisation options, allowing you to easily adjust the results to your exact requirements with just a click or two – you don’t have to perform complicated filtering.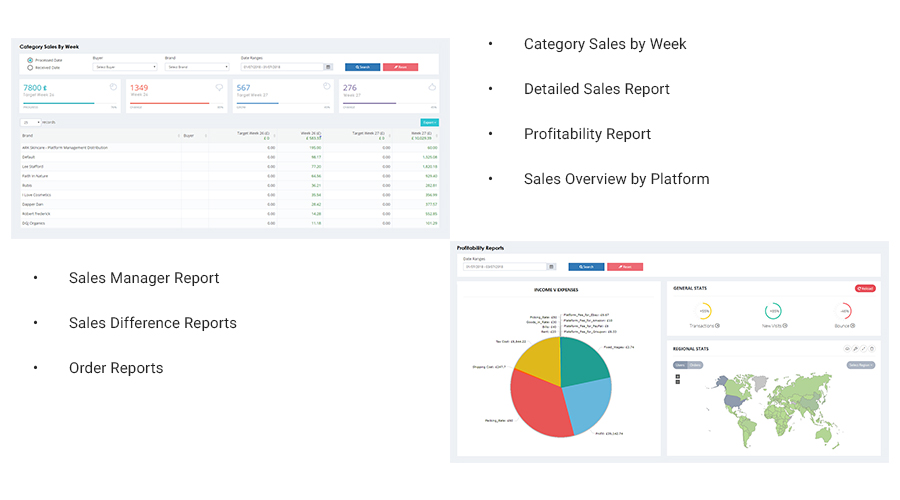 If an award-winning seller like Barry can streamline his reporting and increase his profits by around 35% over the last six months AND secure worldwide exclusivity for 49 beauty brands, just imagine what it can do for your business!
If you’re ready to build your business on better data, you can get started immediately here, but if you have questions, or you want to discuss any other aspect of your eCommerce business, get in touch.